Coronavirus infections dropped again in Hidalgo; deaths did not decrease

José Aurelio Granados Alcantar
Ph.D. in Regional Development and Territorial Planning
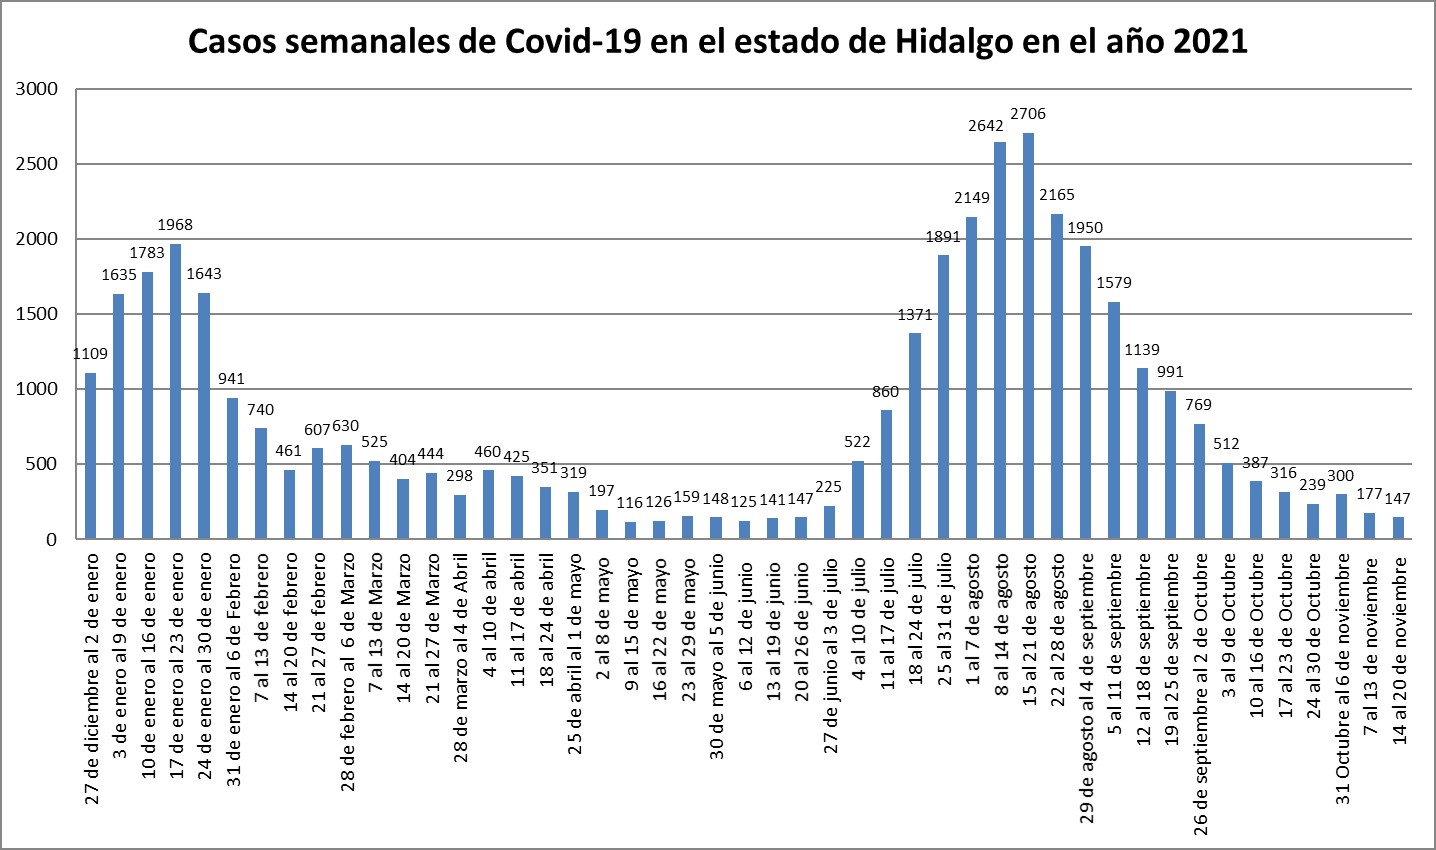
After the increase in coronavirus cases in the week from October 31 to November 6, when 300 cases were reported, in the following week, from November 7 to 13, the number of cases decreased by 41% compared to the previous week, when 177 cases were reported. From November 14 to 20, the number of cases decreased again by 17% compared to the previous week, when 147 cases were recorded.
These infection levels place Hidalgo as the ninth entity with the lowest Active Case Rate. In addition, the number of cases registered this month begins to have a similarity with the records of last May, a period with the lowest level of infections of this pandemic (See Graph 1).
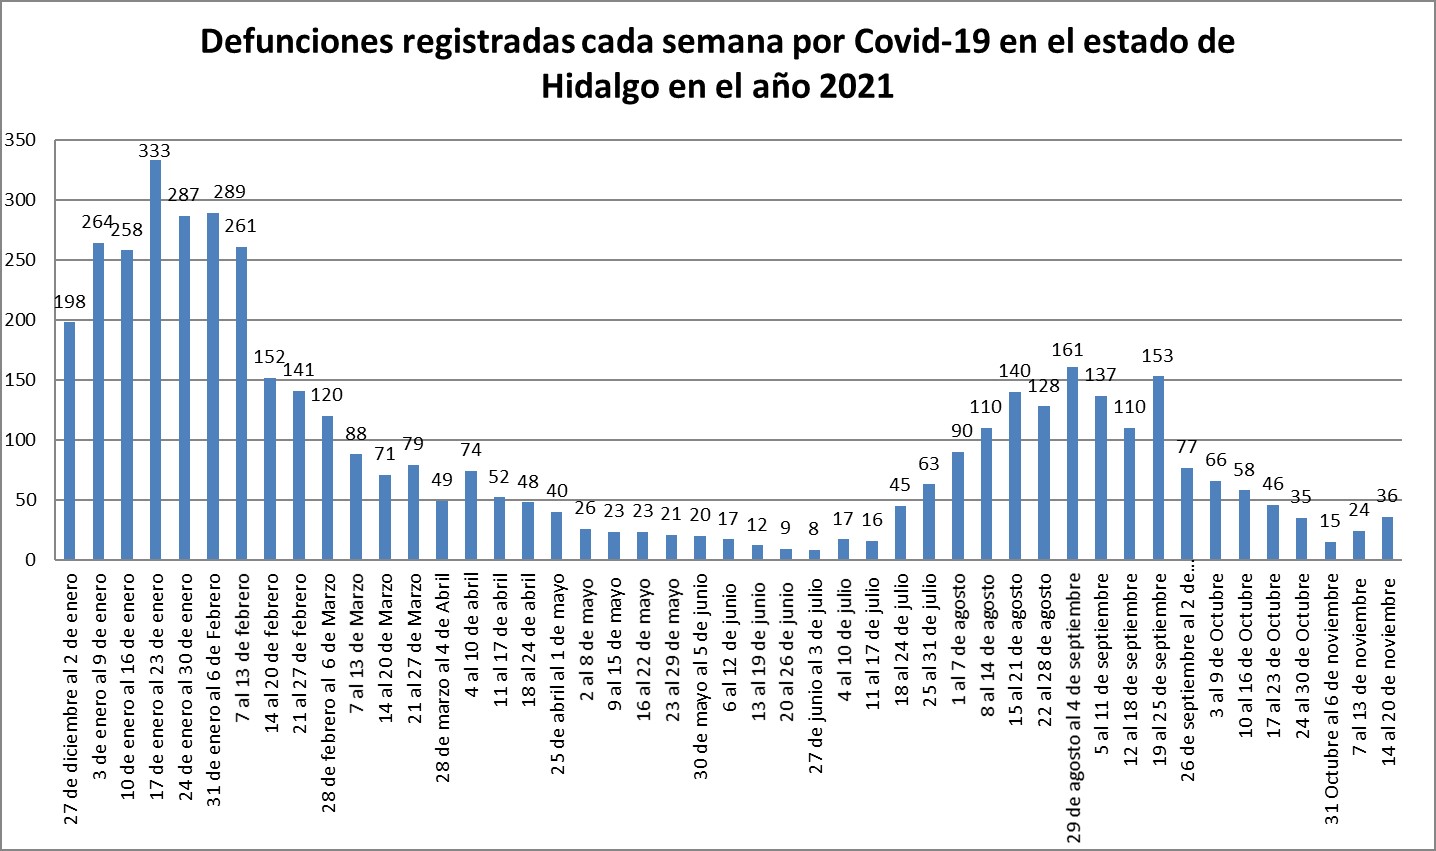
The week from October 31 to November 6 compared to the period from November 7 to 13 increased by 60%, with 15 deaths due to complications of the coronavirus in the first week and 24 in the second. Similarly, from November 14 to 20, there was a 50% increase compared to the previous week, with 36 deaths (see Graph 2).
This number of deaths is unusual for the number of infections; it should be much lower since the Lethality Rate in Hidalgo (number of deaths among the number of cases) as of November is 13 deaths for every one hundred infected by coronavirus, while worldwide it currently oscillates between two deaths for every one hundred infections; which means six times more in Hidalgo than in the rest of the world. This indicator reinforces the thesis that in Mexico only a small proportion of cases of COVID-19 are registered; the great majority are left out because they are not serious or asymptomatic and do not go for testing.
The situation of coronavirus infections as of November 20 in the municipalities of Hidalgo was as follows: in 42 municipalities there were no cases of coronavirus infection recorded; in 17 there was only one infection recorded; in four there were two infections and in five there were three. The municipalities with the highest number of registered cases were Pachuca with 43, Tizayuca with 11, Mineral de Reforma with nine and Tepeapulco with eight, Tulancingo and Zempoala with seven, Atotonilco, Huichapan and Pacula with six (See Table 1).
These numbers of infections show how the pandemic in Hidalgo, in all its municipalities, is controlled if we take into account the conurbations of Pachuca and Mineral de la Reforma, which would have between them 52 infections. However, they have a population of more than half a million inhabitants, approximately they would have an Incidence Rate of 10 cases per one hundred thousand inhabitants, far from the figure of 50 that the World Health Organization (WHO) considers as an indication that infections are not under control.
Finally, as of November 20, the municipalities most affected by the pandemic were: Zapotlán, Pachuca, Tepeapulco and Tolcayuca, which had the highest mortality rates in the state with 510, 489, 419 and 407 deaths per 100,000 inhabitants, respectively. Even Zapotlán and Pachuca are among the ten municipalities with the highest mortality rates at the national level.
| Municipality | Assets | Accumulated | Deaths | Mortality Rate | Lethality |
|---|---|---|---|---|---|
| Pachuca de Soto | 43 | 12611 | 1370 | 489 | 11 |
| Tizayuca | 11 | 4569 | 487 | 355 | 11 |
| Mineral de la Reforma | 9 | 6111 | 502 | 270 | 8 |
| Tepeapulco | 8 | 2320 | 246 | 419 | 11 |
| Tulancingo de Bravo | 7 | 4781 | 589 | 347 | 12 |
| Zempoala | 7 | 1273 | 130 | 257 | 10 |
| Atotonilco de Tula | 6 | 1052 | 138 | 336 | 13 |
| Huichapan | 6 | 991 | 109 | 219 | 11 |
| Pacula | 6 | 44 | 2 | 37 | 5 |
| Actopan | 5 | 1089 | 203 | 331 | 19 |
| Tepehuacán de Guerrero | 5 | 145 | 12 | 37 | 8 |
| Tlaxcoapan | 5 | 751 | 99 | 322 | 13 |
| Ajacuba | 4 | 435 | 54 | 272 | 12 |
| Atotonilco el Grande | 4 | 316 | 43 | 146 | 14 |
| Calnali | 4 | 171 | 12 | 64 | 7 |
| Ixmiquilpan | 4 | 1146 | 211 | 212 | 18 |
| Francisco I. Madero | 3 | 397 | 103 | 265 | 26 |
| Nopala de Villagrán | 3 | 252 | 19 | 105 | 8 |
| San Agustin Tlaxiaca | 3 | 491 | 100 | 255 | 20 |
| Tepeji del Rio de Ocampo | 3 | 2430 | 294 | 314 | 12 |
| Tula de Allende | 3 | 3014 | 440 | 370 | 15 |
| Huehuetla | 2 | 230 | 31 | 114 | 13 |
| Huejutla de Reyes | 2 | 1475 | 194 | 139 | 13 |
| Villa de Tezontepec | 2 | 138 | 27 | 201 | 20 |
| Zacualtipan de Ángeles | 2 | 500 | 59 | 157 | 12 |
| Acatlan | 1 | 208 | 43 | 194 | 21 |
| Agua Blanca de Iturbide | 1 | 102 | 11 | 113 | 11 |
| Apan | 1 | 1379 | 170 | 354 | 12 |
| El Arenal | 1 | 223 | 60 | 297 | 27 |
| Atitalaquia | 1 | 723 | 126 | 391 | 17 |
| Atlapexco | 1 | 126 | 10 | 46 | 8 |
| Cardonal | 1 | 235 | 46 | 232 | 20 |
| Chapulhuacán | 1 | 121 | 23 | 90 | 19 |
| Huasca de Ocampo | 1 | 169 | 28 | 147 | 17 |
| Metepec | 1 | 150 | 25 | 200 | 17 |
| Progreso de Obregón | 1 | 424 | 77 | 303 | 18 |
| San Salvador | 1 | 427 | 84 | 221 | 20 |
| Tasquillo | 1 | 250 | 29 | 165 | 12 |
| Tecozautla | 1 | 318 | 46 | 114 | 14 |
| Tenango de Doria | 1 | 265 | 13 | 66 | 5 |
| Tezontepec de Aldama | 1 | 884 | 127 | 223 | 14 |
| Zapotlán de Juárez | 1 | 404 | 104 | 510 | 26 |
| Acaxochitlán | 0 | 305 | 68 | 147 | 22 |
| Alfajayucan | 0 | 222 | 27 | 122 | 12 |
| Almoloya | 0 | 225 | 17 | 129 | 8 |
| Cuautepec de Hinojosa | 0 | 781 | 139 | 223 | 18 |
| Chapantongo | 0 | 291 | 23 | 157 | 8 |
| Chilcuautla | 0 | 296 | 43 | 219 | 15 |
| Eloxochitlán | 0 | 19 | 0 | 0 | 0 |
| Emiliano Zapata | 0 | 456 | 58 | 367 | 13 |
| Epazoyucan | 0 | 357 | 59 | 368 | 17 |
| Huautla | 0 | 95 | 17 | 73 | 18 |
| Huazalingo | 0 | 88 | 7 | 47 | 8 |
| Jacala de Ledezma | 0 | 67 | 17 | 117 | 25 |
| Jaltocán | 0 | 78 | 14 | 109 | 18 |
| Juarez Hidalgo | 0 | 26 | 3 | 88 | 12 |
| Lolotla | 0 | 66 | 13 | 127 | 20 |
| San Agustín Metzquititlán | 0 | 77 | 10 | 97 | 13 |
| Metztitlan | 0 | 170 | 36 | 162 | 21 |
| Mineral del Chico | 0 | 103 | 14 | 145 | 14 |
| Mineral del Monte | 0 | 375 | 49 | 311 | 13 |
| The Mission | 0 | 48 | 8 | 73 | 17 |
| Mixquiahuala de Juárez | 0 | 744 | 134 | 268 | 18 |
| Molango de Escamilla | 0 | 303 | 12 | 96 | 4 |
| Nicolas Flores | 0 | 55 | 2 | 27 | 4 |
| Omitlán de Juárez | 0 | 125 | 15 | 142 | 12 |
| San Felipe Orizatlan | 0 | 170 | 39 | 93 | 23 |
| Pisaflores | 0 | 87 | 11 | 58 | 13 |
| San Bartolo Tutotepec | 0 | 203 | 15 | 75 | 7 |
| Santiago de Anaya | 0 | 213 | 33 | 179 | 15 |
| Santiago Tulantepec de Lugo Guerrero | 0 | 856 | 93 | 232 | 11 |
| Singuilucan | 0 | 165 | 34 | 196 | 21 |
| Tepetitlan | 0 | 146 | 22 | 187 | 15 |
| Tetepango | 0 | 201 | 23 | 184 | 11 |
| Tianguistengo | 0 | 91 | 13 | 81 | 14 |
| Tlahuelilpan | 0 | 391 | 53 | 256 | 14 |
| Tlahuiltepa | 0 | 66 | 3 | 27 | 5 |
| Tlanalapa | 0 | 268 | 32 | 287 | 12 |
| Tlanchinol | 0 | 171 | 25 | 59 | 15 |
| Tolcayuca | 0 | 421 | 72 | 407 | 17 |
| Xochiatipan | 0 | 30 | 6 | 28 | 20 |
| Xochicoatlán | 0 | 106 | 8 | 97 | 8 |
| Yahualica | 0 | 66 | 11 | 42 | 17 |
| Zimapán | 0 | 385 | 61 | 143 | 16 |
Source: Own elaboration based on information "Monitoreo de la Situación del Covid-19 en los municipios de México ". https://covid19.ciga.unam.mx/apps/covid-19-monitoreo-de-la-situaci%C3%B3n-por-municipios/explore
Source: Own elaboration based on SSA Daily Technical Communiqués. https://www.gob.mx/salud/documentos/coronavirus-covid-19-comunicado-tecnico-diario
Source: Own elaboration based on SSA Daily Technical Communiqués. https://www.gob.mx/salud/documentos/coronavirus-covid-19-comunicado-tecnico-diario
WHO IS...?
José Aurelio Granados Alcantar holds a PhD in Regional Development and Territorial Planning from the University of Barcelona, Spain. He is a research professor in the academic area of Sociology and Demography, Institute of Social Sciences and Humanities (ICSHu) at the Autonomous University of the State of Hidalgo (UAEH). He is a member of the National System of Researchers, level I.