Coronavirus transmission in Hidalgo in decline until September 11, but not deaths

José Aurelio Granados Alcantar
Ph.D. in Regional Development and Territorial Planning
All available indicators to evaluate the epidemiological situation of COVID-19 indicate that the worst of the third transmission in Hidalgo is over. This past week (September 5-11), 1,579 cases were recorded, 19% less than last week (August 29-September 4), when 1,950 cases were recorded, but 42% less than the week of August 15-21, when the highest number of infections of this wave was recorded with 2,706 (see graph 1).
For this reason, the Effective Reproduction Rate (the average number of people to whom each infected individual can transmit the virus) was at a low level of transmission with 0.8, that is, one infected person does not infect another (See image 1).
Similarly, hospitalizations continued to decline, with general hospital beds at 53.4% on September 11, compared to 76.4% occupancy on August 21; ventilator beds were 43.7% on September 11, compared to 66.9% on August 21; and the occupancy of ventilator beds in Intensive Care Units (ICU) was 27.3% on September 11, compared to 84.6% on August 21.
While cases of coronavirus transmission continue to decline, deaths are not. Even the week of August 29-September 4 was the week with the highest number of deaths in this third wave, with 161 deaths reported. Although in this last week they dropped to 137 deaths (see Graph 2), these are still very hard figures. However, given the decline in the transmission of infections and the levels of ICU ventilator beds, it is now expected that in the following weeks there will be a considerable drop in the number of deaths.
On the other hand, municipal epidemiological curves show that transmission in the five most populated municipalities in the state: Pachuca, Mineral de la Reforma, Tizayuca, Tulancingo and Huejutla are in decline. Only in the municipalities of Apan, Tepeapulco and Atotonilco de Tula has transmission not yet been controlled (see Figures 1 to 6).
In the municipalities with the largest populations, there has been a decrease in cases. Tulancingo registered the greatest decrease, going from 338 infections on August 21 to 140 on September 11, a reduction of almost 60% of infections in these three weeks; similarly, Pachuca, Tizayuca, Tula, Huejutla, Tepeji del Río, Mineral de la Reforma, Ixmiquilpan and Atotonilco de Tula have reduced their infections (see Table 1).
The highest incidence rate of coronavirus infections as of September 21 is in the municipalities of Molango, Nopala, Apan, Xochicoatlán, Tepeapulco, Ajacuba, Tlaxcoapan, Juárez Hidalgo and Tasquillo with rates above 100 infected per 100,000 inhabitants, which indicates that the epidemic is out of control in these municipalities according to the parameters of the World Health Organization (WHO).
Only Eloxochitlán, Jaltocán and Nicolás Flores have no registered cases of coronavirus in the state as of September 21; while Cardonal, Tenango and Xochiatipan have only one case (See Table 2).
With these indicators, it is expected that next week, new municipalities will announce that they will begin the process of opening primary and secondary schools, thus gradually incorporating children and adolescents to face-to-face educational activities, which have been cancelled since April of last year.
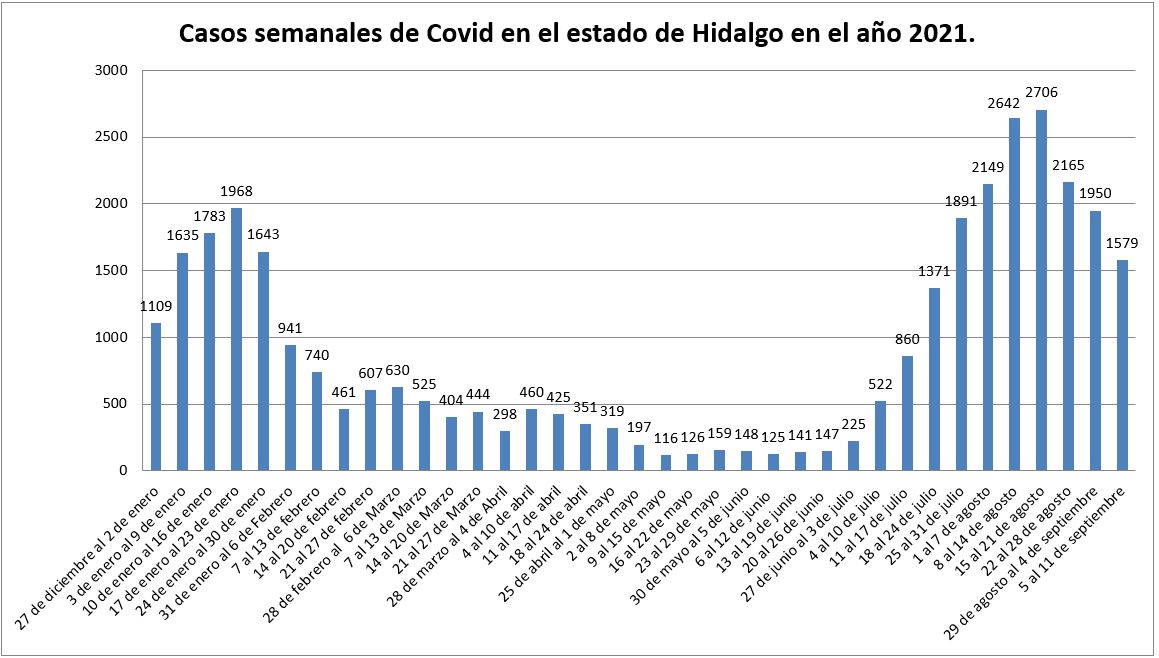
Source: Own elaboration based on SSA Daily Technical Communiqués. https://www.gob.mx/salud/documentos/
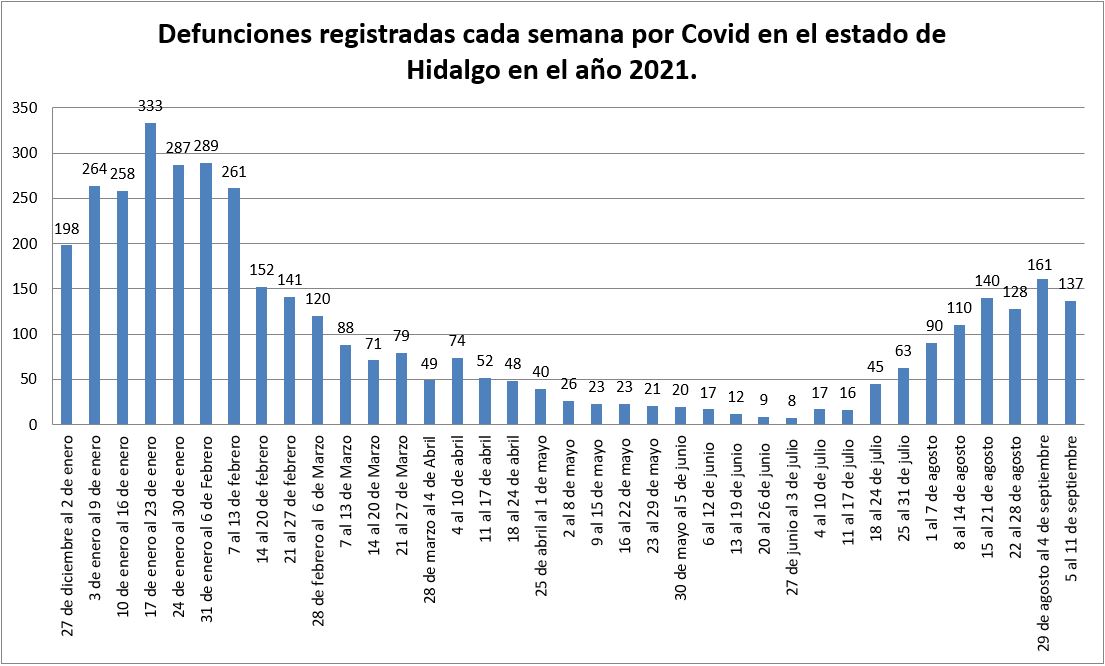
Source: Own elaboration based on SSA Daily Technical Communiqués. https://www.gob.mx/salud/documentos/
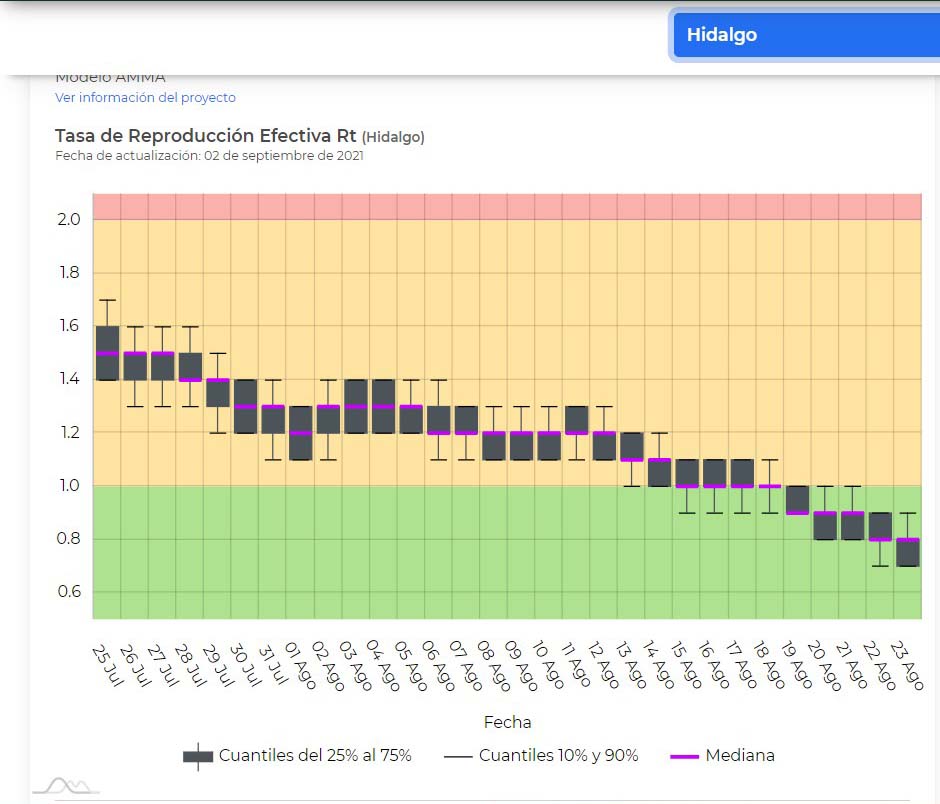
Source: Covid-19 research and data modeling products. National Council for Science and Technology. Date of Consultation September 11. https://salud.conacyt.mx/coronavirus/
Coronavirus epidemic curves in the main municipalities of Hidalgo.
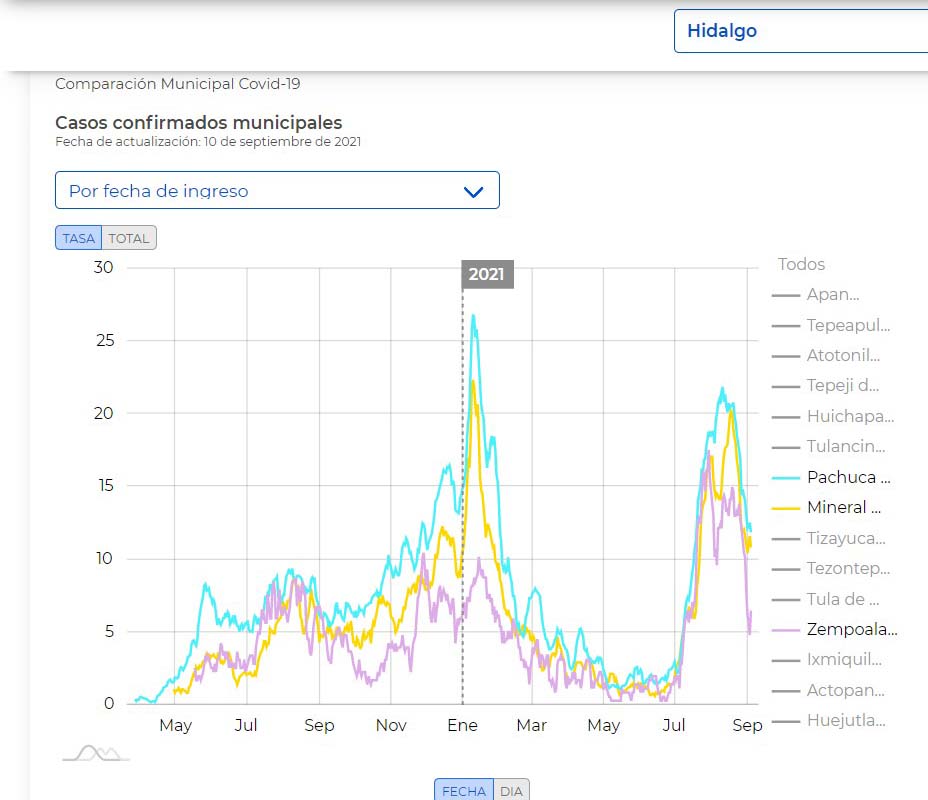
Figure 1. Pachuca, Mineral de la Reforma and Zempoala
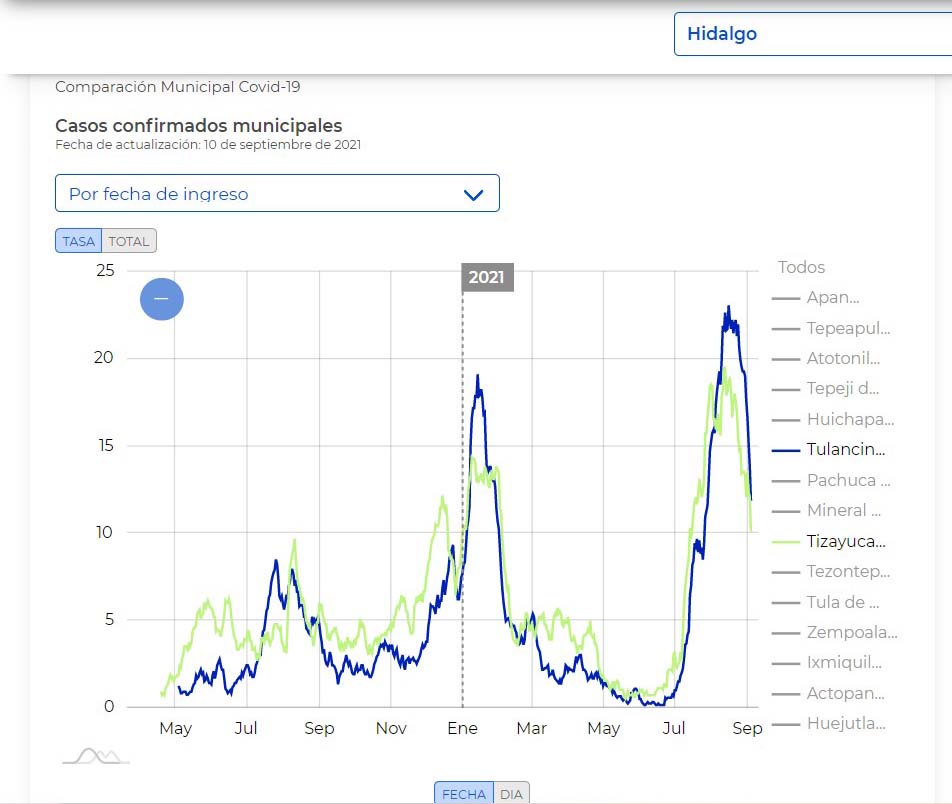
Figure 2. Tulancingo and Tizayuca
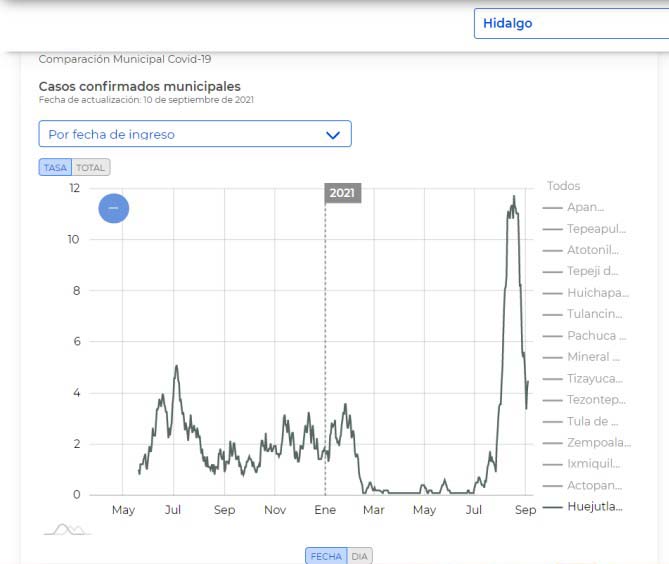
Figure 3. Huejutla
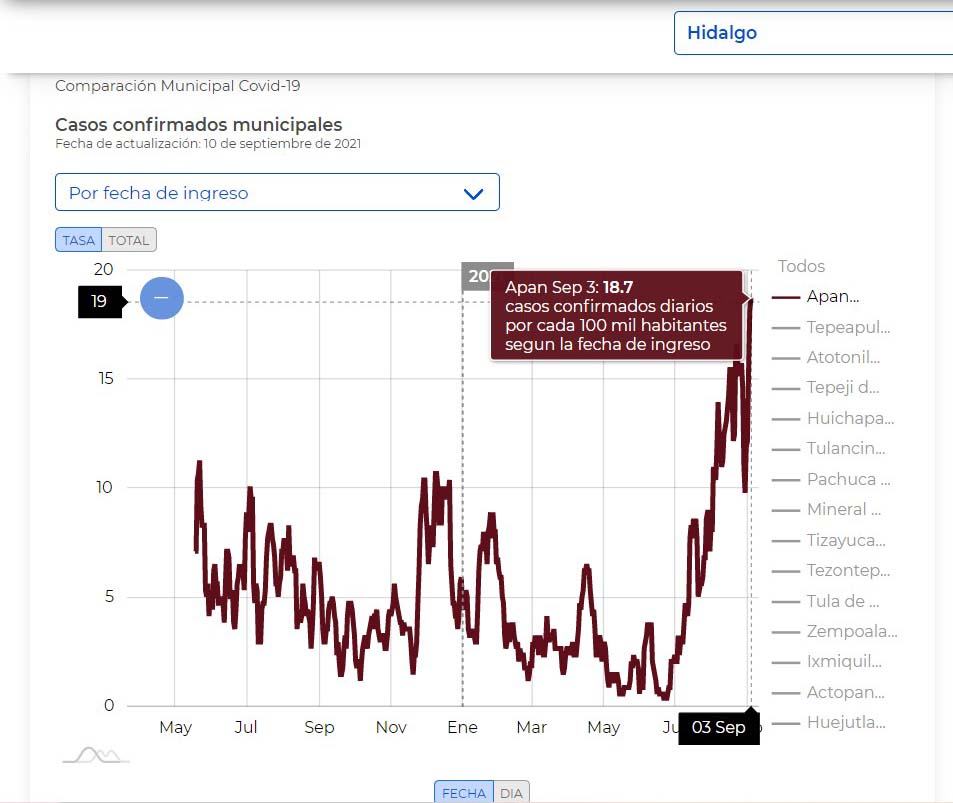
Figure 4. Apan
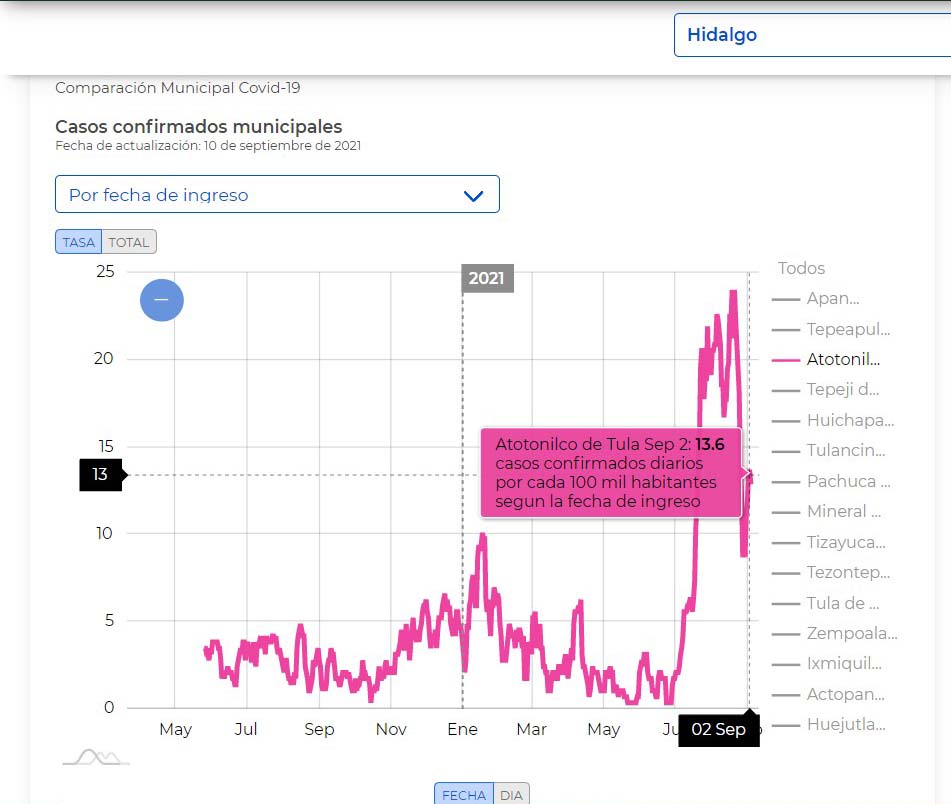
Figure 5. Atotonilco de Tula
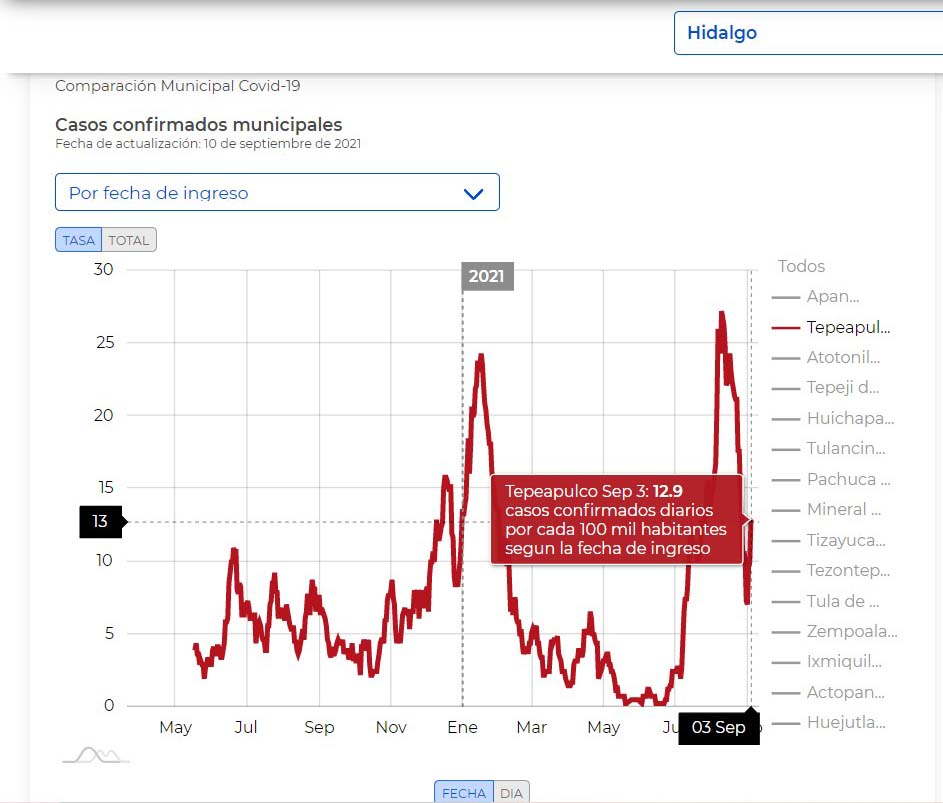
Figure 6. Tepeapulco
Source: Covid-19 research and data modeling products. National Council for Science and Technology. Date of Consultation September 11. https://salud.conacyt.mx/coronavirus/investigacion/
| Municipality | Population | Cases as of August 21 | Cases as of September 11 | Difference between September 11, and August 21, 2009. |
|---|---|---|---|---|
| Tulancingo | 168,369 | 338 | 140 | -198 |
| Pachuca de Soto | 314,331 | 389 | 269 | -120 |
| Tizayuca | 168,302 | 202 | 113 | -89 |
| Tula de Allende | 115,107 | 136 | 48 | -88 |
| Huejutla de Reyes | 126,781 | 92 | 27 | -65 |
| Tepeji del Rio | 90,546 | 124 | 67 | -57 |
| Mineral de la Reforma | 202,749 | 190 | 138 | -52 |
| Ixmiquilpan | 98,654 | 70 | 26 | -44 |
| Atotonilco de Tula | 62,470 | 67 | 25 | -42 |
| Zempoala | 57,906 | 64 | 24 | -40 |
| Tepeapulco | 56,245 | 108 | 70 | -38 |
| Cuautepec de Hinojosa | 60,421 | 60 | 23 | -37 |
| Atotonilco el Grande | 30,135 | 36 | 7 | -29 |
| Santiago | 39,561 | 64 | 35 | -29 |
| Zacualtipán | 38,155 | 46 | 18 | -28 |
| Zimapán | 39,927 | 38 | 10 | -28 |
| Actopan | 61,002 | 56 | 31 | -25 |
| Atitalaquia | 31,525 | 37 | 12 | -25 |
| Ajacuba | 18,872 | 42 | 21 | -21 |
| Tasquillo | 17,441 | 38 | 18 | -20 |
| San Salvador | 36,796 | 23 | 6 | -17 |
| Tenango de Doria | 17,503 | 18 | 1 | -17 |
| Tetepango | 11,768 | 23 | 6 | -17 |
| El Arenal | 19,836 | 22 | 7 | -15 |
| Mineral del Monte | 14,324 | 19 | 5 | -14 |
| Tlaxcoapan | 28,626 | 43 | 30 | -13 |
| Tepehuacán | 31,235 | 16 | 4 | -12 |
| San Bartolo Tutotepec | 17,699 | 15 | 4 | -11 |
| Alfajayucan | 19,162 | 15 | 5 | -10 |
| Francisco I. Madero | 36,248 | 14 | 4 | -10 |
| Huehuetla | 22,846 | 15 | 5 | -10 |
| Lolotla | 9,474 | 14 | 4 | -10 |
| Tezontepec de A. | 55,134 | 33 | 23 | -10 |
| Metztitlan | 20,962 | 11 | 3 | -8 |
| Mixquiahuala | 47,222 | 29 | 21 | -8 |
| Tianguistengo | 14,340 | 14 | 6 | -8 |
| San Felipe Orizatlan | 38,492 | 13 | 5 | -8 |
| Cardonal | 19,431 | 8 | 1 | -7 |
| Omitlán de Juárez | 9,295 | 12 | 5 | -7 |
| Chapulhuacán | 22,903 | 8 | 2 | -6 |
| Pisaflores | 18,723 | 10 | 4 | -6 |
| Tepetitlan | 10,830 | 14 | 8 | -6 |
| Villa de Tezontepec | 13,032 | 8 | 2 | -6 |
| Huasca de Ocampo | 17,607 | 10 | 5 | -5 |
| Tlahuiltepa | 9,086 | 8 | 3 | -5 |
| Chapantongo | 12,967 | 10 | 7 | -3 |
| Chilcuautla | 18,909 | 13 | 10 | -3 |
| Metepec | 13,078 | 10 | 7 | -3 |
| Nicolas Flores | 6,265 | 3 | 0 | -3 |
| Tecozautla | 38,010 | 15 | 12 | -3 |
| Zapotlán de Juárez | 21,443 | 9 | 6 | -3 |
| Acaxochitlán | 46,065 | 15 | 13 | -2 |
| Jacala | 12,290 | 4 | 2 | -2 |
| Jaltocán | 10,523 | 2 | 0 | -2 |
| Singuilucan | 15,142 | 5 | 3 | -2 |
| Acatlan | 22,268 | 6 | 4 | -2 |
| Santiago de Anaya | 18,329 | 10 | 9 | -1 |
| Eloxochitlán | 2,593 | 1 | 0 | -1 |
| Calnali | 16,150 | 7 | 7 | 0 |
| Emiliano Zapata | 15,175 | 13 | 13 | 0 |
| Juarez Hidalgo | 2,895 | 3 | 3 | 0 |
| Tlahuelilpan | 19,067 | 14 | 14 | 0 |
| Yahualica | 24,674 | 4 | 4 | 0 |
| Atlapexco | 19,812 | 6 | 7 | 1 |
| Huautla | 20,673 | 5 | 6 | 1 |
| Huazalingo | 12,766 | 5 | 6 | 1 |
| Huichapan | 47,425 | 46 | 47 | 1 |
| Mineral del Chico | 8,878 | 4 | 5 | 1 |
| Progress | 23,641 | 19 | 20 | 1 |
| Tlanalapa | 11,113 | 6 | 7 | 1 |
| Xochiatipan | 18,260 | 0 | 1 | 1 |
| The Mission | 9,819 | 1 | 3 | 2 |
| Pacula | 4,748 | 1 | 3 | 2 |
| St. Augustine Metz. | 9,449 | 2 | 4 | 2 |
| Tolcayuca | 21,362 | 6 | 8 | 2 |
| White Water | 10,313 | 3 | 6 | 3 |
| Almoloya | 12,546 | 6 | 9 | 3 |
| Epazoyucan | 16,285 | 10 | 14 | 4 |
| San Agustin Tlaxiaca | 38,891 | 10 | 15 | 5 |
| Xochicoatlán | 7,015 | 4 | 9 | 5 |
| Molango | 11,578 | 19 | 25 | 6 |
| Apan | 46,681 | 52 | 62 | 10 |
| Tlanchinol | 37,722 | 4 | 15 | 11 |
| Nopala | 16,948 | 10 | 26 | 16 |
Source: Own elaboration based on the information "Monitoreo de la Situación del Covid-19 en los municipios de México " https://covid19.ciga.unam.mx/apps/covid-19-monitoreo-de-la-situaci%C3%B3n-por-municipios/explore
| Municipality | Population | Cases as of September 21 | Incidence Rate (Cases / Population per hundred thousand) |
|---|---|---|---|
| Molango | 11,578 | 25 | 215.9 |
| Nopala | 16,948 | 26 | 153.4 |
| Apan | 46,681 | 62 | 132.8 |
| Xochicoatlán | 7,015 | 9 | 128.3 |
| Tepeapulco | 56,245 | 70 | 124.5 |
| Ajacuba | 18,872 | 21 | 111.3 |
| Tlaxcoapan | 28,626 | 30 | 104.8 |
| Juarez Hidalgo | 2,895 | 3 | 103.6 |
| Tasquillo | 17,441 | 18 | 103.2 |
| Huichapan | 47,425 | 47 | 99.1 |
| Santiago | 39,561 | 35 | 88.5 |
| Epazoyucan | 16,285 | 14 | 86 |
| Emiliano Zapata | 15,175 | 13 | 85.7 |
| Pachuca de Soto | 314,331 | 269 | 85.6 |
| Progress | 23,641 | 20 | 84.6 |
| Tulancingo | 168,369 | 140 | 83.2 |
| Tepeji del Rio | 90,546 | 67 | 74 |
| Tepetitlan | 10,830 | 8 | 73.9 |
| Tlahuelilpan | 19,067 | 14 | 73.4 |
| Almoloya | 12,546 | 9 | 71.7 |
| Mineral de la Reforma | 202,749 | 138 | 68.1 |
| Tizayuca | 168,302 | 113 | 67.1 |
| Pacula | 4,748 | 3 | 63.2 |
| Tlanalapa | 11,113 | 7 | 63 |
| White Water | 10,313 | 6 | 58.2 |
| Mineral del Chico | 8,878 | 5 | 56.3 |
| Chapantongo | 12,967 | 7 | 54 |
| Omitlán de Juárez | 9,295 | 5 | 53.8 |
| Metepec | 13,078 | 7 | 53.5 |
| Chilcuautla | 18,909 | 10 | 52.9 |
| Tetepango | 11,768 | 6 | 51 |
| Actopan | 61,002 | 31 | 50.8 |
| Santiago de Anaya | 18,329 | 9 | 49.1 |
| Zacualtipán | 38,155 | 18 | 47.2 |
| Huazalingo | 12,766 | 6 | 47 |
| Mixquiahuala | 47,222 | 21 | 44.5 |
| Calnali | 16,150 | 7 | 43.3 |
| St. Augustine Metz. | 9,449 | 4 | 42.3 |
| Lolotla | 9,474 | 4 | 42.2 |
| Tianguistengo | 14,340 | 6 | 41.8 |
| Tezontepec de A. | 55,134 | 23 | 41.7 |
| Tula de Allende | 115,107 | 48 | 41.7 |
| Zempoala | 57,906 | 24 | 41.4 |
| Atotonilco de Tula | 62,470 | 25 | 40 |
| Tlanchinol | 37,722 | 15 | 39.8 |
| San Agustin Tlaxiaca | 38,891 | 15 | 38.6 |
| Cuautepec de Hinojosa | 60,421 | 23 | 38.1 |
| Atitalaquia | 31,525 | 12 | 38.1 |
| Tolcayuca | 21,362 | 8 | 37.4 |
| Atlapexco | 19,812 | 7 | 35.3 |
| El Arenal | 19,836 | 7 | 35.3 |
| Mineral del Monte | 14,324 | 5 | 34.9 |
| Tlahuiltepa | 9,086 | 3 | 33 |
| Tecozautla | 38,010 | 12 | 31.6 |
| The Mission | 9,819 | 3 | 30.6 |
| Huautla | 20,673 | 6 | 29 |
| Huasca de Ocampo | 17,607 | 5 | 28.4 |
| Acaxochitlán | 46,065 | 13 | 28.2 |
| Zapotlán de Juárez | 21,443 | 6 | 28 |
| Ixmiquilpan | 98,654 | 26 | 26.4 |
| Alfajayucan | 19,162 | 5 | 26.1 |
| Zimapán | 39,927 | 10 | 25 |
| Atotonilco el Grande | 30,135 | 7 | 23.2 |
| San Bartolo Tutotepec | 17,699 | 4 | 22.6 |
| Huehuetla | 22,846 | 5 | 21.9 |
| Pisaflores | 18,723 | 4 | 21.4 |
| Huejutla de Reyes | 126,781 | 27 | 21.3 |
| Singuilucan | 15,142 | 3 | 19.8 |
| Acatlan | 22,268 | 4 | 18 |
| San Salvador | 36,796 | 6 | 16.3 |
| Jacala | 12,290 | 2 | 16.3 |
| Yahualica | 24,674 | 4 | 16.2 |
| Villa de Tezontepec | 13,032 | 2 | 15.3 |
| Metztitlan | 20,962 | 3 | 14.3 |
| San Felipe Orizatlan | 38,492 | 5 | 13 |
| Tepehuacán | 31,235 | 4 | 12.8 |
| Francisco I. Madero | 36,248 | 4 | 11 |
| Chapulhuacán | 22,903 | 2 | 8.7 |
| Tenango de Doria | 17,503 | 1 | 5.7 |
| Xochiatipan | 18,260 | 1 | 5.5 |
| Cardonal | 19,431 | 1 | 5.1 |
| Nicolas Flores | 6,265 | 0 | 0 |
| Jaltocán | 10,523 | 0 | 0 |
| Eloxochitlán | 2,593 | 0 | 0 |
Source: Own elaboration based on the information "Monitoreo de la Situación del Covid-19 en los municipios de México " https://covid19.ciga.unam.mx/apps/covid-19-monitoreo-de-la-situaci%C3%B3n-por-municipios/explore
WHO IS...?
José Aurelio Granados Alcantar holds a PhD in Regional Development and Territorial Planning from the University of Barcelona, Spain. He is a research professor in the academic area of Sociology and Demography, Institute of Social Sciences and Humanities (ICSHu) at the Autonomous University of the State of Hidalgo (UAEH). He is a member of the National System of Researchers, level I.