Optimistic national outlook in the third wave of the pandemic

José Aurelio Granados Alcantar
Ph.D. in Regional Development and Territorial Planning
The third wave of coronavirus transmission has been left behind, and currently the levels of contagion in all the entities of the country are low. From July to September 2021, the months that included it, there were 1,141,873 cases and 44,257 deaths. However, the intensity of infections and deaths was different in each state.
It is obvious that the regions with the largest populations, such as Mexico City (CDMX) and the State of Mexico, registered the highest number of infections, with 260,264 and 102,313 cases, respectively. However, if the analysis is made by the number of cases in the months from July to September between the number of population of each state, it becomes clear that the five states with the highest accumulated incidence rate in this wave were: Mexico City with 2,825.9 cases per 100,000 inhabitants, followed by Colima with 2,646.1, Tabasco with 2,261.8, Baja California Sur with 1,908.7 and Campeche with 1,821.6 cases.
The least affected were: Aguascalientes, Michoacán, Baja California, Chihuahua and Chiapas with incidence rates of 489.0, 454.3, 272.6, 202.7 and 179.2 cases per 100,000 inhabitants, respectively. Hidalgo had a rate of 668.5 infections per 100,000 inhabitants, below the national average of 947.8, three times less than the rate recorded in Mexico City, which was the entity with the highest intensity of infections (see Table 1).
As for the deaths registered due to complications of COVID-19 in this third wave, more than half were concentrated in seven entities: CDMX with 5,859 deaths, State of Mexico with 3,603 deaths, Jalisco with 3,387 deaths, Nuevo Leon with 2,653 deaths, Puebla with 2,229 deaths and Sinaloa with 2,033 deaths. Hidalgo registered 1,234 deaths due to complications during this period.
If we analyze the case fatality rate, i.e. deaths among the number of cases in the period, an indicator that only refers to the deceased persons infected by COVID-19, we find that Michoacán is the entity with the highest case fatality rate of the third wave with 7.4 deaths per 100 registered cases; followed by Sinaloa with 7.0 deaths per 100, Puebla with 6.8 deaths, Morelos with 6.7, Veracruz with 6.5, Baja California with 6.3 and Hidalgo, which ranked seventh with a case fatality rate of 6 deaths per 100 registered coronavirus infections. The states with the lowest case fatality rates were: Tabasco, CDMX, Guanajuato, San Luis Potosí and Tlaxcala with 1.8, 2.3, 2.4, 2.8 and 3.3 deaths per 100 registered infections, respectively (see Table 2).
On the other hand, if we want to know the effect that coronavirus deaths have for the entire population in each state, then we analyze the mortality rate, i.e. the number of deaths among the population size by COVID-19 during this period. With this indicator, we found that Colima, Baja California Sur, Sinaloa and Campeche were the most affected states in the third wave due to deaths in relation to their population, since they registered 101.6, 92.4, 68.5, 67.2 and 66.6 deaths per 100,000 inhabitants. The effect was weaker in Chiapas, Chihuahua, Guanajuato and Baja California, with coronavirus mortality rates of 9.0, 9.4, 15.6 and 17.2 deaths per 100,000 inhabitants. The state of Hidalgo recorded a mortality rate of 60 deaths per 100,000 inhabitants, above the national average of 35.1 (see Table 1).
Coronavirus outlook in Hidalgo
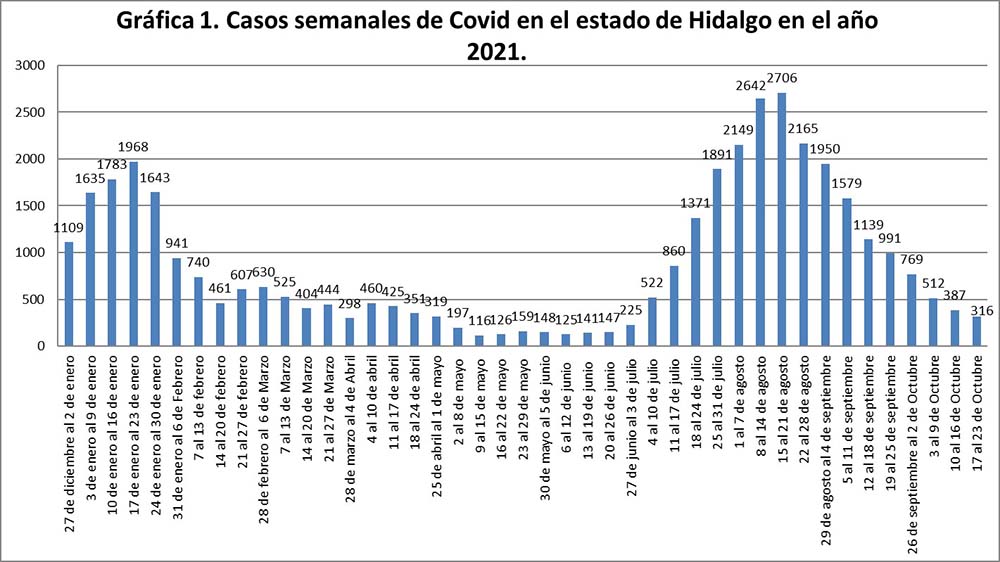
Both the number of infections and deaths continue to decrease in the state of Hidalgo during the month of October; although they are still not at the level of infections recorded between May and June of this year, which were lower during the pandemic, if this same trend continues, it is likely that in November we will have the same levels as before the third wave.
During the week of October 17-23, 316 infections were reported in the entire state of Hidalgo, a reduction of 18% compared to the week of October 10-16, when 387 cases were reported (See Graph 1).
The low levels of contagion also led the state to rank among the states with the lowest levels of hospitalizations; in terms of the number of general hospital beds up to October 24, Hidalgo was the sixth state with the lowest percentage of hospitalizations of this type with 16.6%, the eighth in terms of occupation of beds with ventilators with 14.7% and the sixth with the lowest proportion of beds with ventilators in Intensive Care Units (ICU) with 3.6%. It is far behind Morelos and Colima, which had all the beds of this type occupied, and Querétaro and Zacatecas, which have 85% and 72.2% of ICU beds occupied (see IRAG Network Information System: https: //www.gits.igg.unam.mx/red-irag-dashboard/reviewHome).
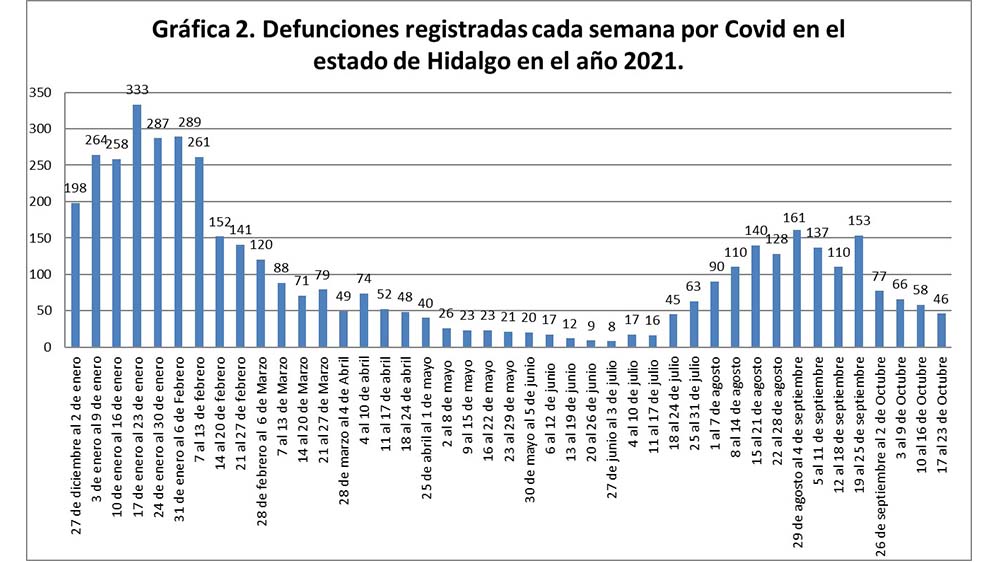
With these hospitalization indicators, it is obvious that deaths are also decreasing and it is to be expected that they will continue to decrease. In the week of October 17-23, 46 deaths from Covid were recorded, while the previous week (October 10-16) there were 58 (see Graph 2).
Coronavirus transmission in the vast majority of municipalities in the entity is low, only the municipality of Xochicoatlán is where it can be said that the level of contagion is out of control according to the parameters of the World Health Organization (WHO), as they have incidence rates above 50 infections per hundred thousand inhabitants; others where there is a serious risk of contagion are Jacala and Tepehuacán. However, there are 25 municipalities where the incidence rate is zero, i.e. there were no cases as of October 23.
| Entity | Population | Cases | Incidence Rate |
|---|---|---|---|
| National | 126,014,024 | 1141873 | 906.1 |
| + CDMX | 9,209,944 | 260,264 | 2825.9 |
| + Colima | 731,391 | 19,353 | 2646.1 |
| + Tabasco | 2,402,598 | 54,342 | 2261.8 |
| + Baja California Sur | 798,447 | 15,240 | 1908.7 |
| + Campeche | 928,363 | 16,911 | 1821.6 |
| + Nayarit | 1,235,456 | 20,069 | 1624.4 |
| + Quintana Roo | 1,857,985 | 24,651 | 1326.8 |
| + Nuevo León | 5,784,442 | 69,404 | 1199.8 |
| + San Luis Potosí | 2,822,255 | 33,635 | 1191.8 |
| + Querétaro | 2,368,467 | 23,596 | 996.3 |
| + Yucatan | 2,320,898 | 22,749 | 980.2 |
| + Sonora | 2,944,840 | 28,113 | 954.7 |
| + Sinaloa | 3,026,943 | 28,850 | 953.1 |
| + Warrior | 3,540,685 | 32,618 | 921.2 |
| + Tamaulipas | 3,527,735 | 30,980 | 878.2 |
| + Jalisco | 8,348,151 | 65,297 | 782.2 |
| + Morelos | 1,971,520 | 13,481 | 683.8 |
| + Durango | 1,832,650 | 12,486 | 681.3 |
| + Oaxaca | 4,132,148 | 28,125 | 680.6 |
| + Hidalgo | 3,082,841 | 20,610 | 668.5 |
| + Guanajuato | 6,166,934 | 40,740 | 660.6 |
| + Veracruz | 8,062,579 | 52,091 | 646.1 |
| + Coahuila | 3,146,771 | 19,285 | 612.9 |
| + Tlaxcala | 1,342,977 | 8,191 | 609.9 |
| + Mexico | 16,992,418 | 102,313 | 602.1 |
| + Zacatecas | 1,622,138 | 9,375 | 577.9 |
| + Puebla | 6,583,278 | 32,764 | 497.7 |
| + Aguascalientes | 1,425,607 | 6,971 | 489 |
| + Michoacán | 4,748,846 | 21,574 | 454.3 |
| + Baja California | 3,769,020 | 10,275 | 272.6 |
| + Chihuahua | 3,741,869 | 7,586 | 202.7 |
| + Chiapas | 5,543,828 | 9,934 | 179.2 |
Source: Own elaboration based on SSA Daily Communiqués. https://www.gob.mx/salud/documentos/coronavirus-covid-19-comunicado-tecnico-diario
| Entity | Cases | Deaths | Case fatality rate |
|---|---|---|---|
| National | 1,141,873 | 44257 | 3.9 |
| Michoacán | 21,574 | 1,594 | 7.4 |
| Sinaloa | 28,850 | 2,033 | 7 |
| Puebla | 32,764 | 2,229 | 6.8 |
| Morelos | 13,481 | 903 | 6.7 |
| Veracruz | 52,091 | 3,369 | 6.5 |
| Baja California | 10,275 | 647 | 6.3 |
| Hidalgo | 20,610 | 1,234 | 6 |
| Jalisco | 65,297 | 3,387 | 5.2 |
| Sonora | 28,113 | 1,416 | 5 |
| Chiapas | 9,934 | 500 | 5 |
| Baja California Sur | 15,240 | 738 | 4.8 |
| Chihuahua | 7,586 | 353 | 4.7 |
| Yucatan | 22,749 | 1,050 | 4.6 |
| Nayarit | 20,069 | 846 | 4.2 |
| Aguascalientes | 6,971 | 293 | 4.2 |
| Guerrero | 32,618 | 1,360 | 4.2 |
| Zacatecas | 9,375 | 387 | 4.1 |
| Oaxaca | 28,125 | 1,146 | 4.1 |
| Tamaulipas | 30,980 | 1,241 | 4 |
| Colima | 19,353 | 743 | 3.8 |
| Nuevo León | 69,404 | 2,653 | 3.8 |
| Coahuila | 19,285 | 721 | 3.7 |
| Quintana Roo | 24,651 | 910 | 3.7 |
| Campeche | 16,911 | 618 | 3.7 |
| Querétaro | 23,596 | 836 | 3.5 |
| Mexico | 102,313 | 3,603 | 3.5 |
| Durango | 12,486 | 436 | 3.5 |
| Tlaxcala | 8,191 | 269 | 3.3 |
| San Luis Potosi | 33,635 | 947 | 2.8 |
| Guanajuato | 40,740 | 964 | 2.4 |
| Mexico City | 260,264 | 5,859 | 2.3 |
| Tabasco | 54,342 | 972 | 1.8 |
Source: Own elaboration based on SSA Daily Communiqués. https://www.gob.mx/salud/documentos/coronavirus-covid-19-comunicado-tecnico-diario
| Entities | Population | Deaths | Mortality Rate |
|---|---|---|---|
| National | 126,014,024 | 44257 | 35.1 |
| + Colima | 731,391 | 293 | 101.6 |
| + Baja California Sur | 798,447 | 647 | 92.4 |
| + Nayarit | 1,235,456 | 738 | 68.5 |
| + Sinaloa | 3,026,943 | 618 | 67.2 |
| + Campeche | 928,363 | 500 | 66.6 |
| CMMX | 9,209,944 | 353 | 63.6 |
| + Quintana Roo | 1,857,985 | 5,859 | 49 |
| + Sonora | 2,944,840 | 721 | 48.1 |
| + Nuevo León | 5,784,442 | 743 | 45.9 |
| + Morelos | 1,971,520 | 436 | 45.8 |
| + Yucatan | 2,320,898 | 964 | 45.2 |
| + Veracruz | 8,062,579 | 1,360 | 41.8 |
| + Jalisco | 8,348,151 | 1,234 | 40.6 |
| + Tabasco | 2,402,598 | 3,387 | 40.5 |
| + Hidalgo | 3,082,841 | 3,603 | 40 |
| + Warrior | 3,540,685 | 1,594 | 38.4 |
| + Querétaro | 2,368,467 | 903 | 35.3 |
| + Tamaulipas | 3,527,735 | 846 | 35.2 |
| + Puebla | 6,583,278 | 2,653 | 33.9 |
| + Michoacán | 4,748,846 | 1,146 | 33.6 |
| + San Luis Potosí | 2,822,255 | 2,229 | 33.6 |
| + Oaxaca | 4,132,148 | 836 | 27.7 |
| + Zacatecas | 1,622,138 | 910 | 23.9 |
| + Durango | 1,832,650 | 947 | 23.8 |
| + Coahuila | 3,146,771 | 2,033 | 22.9 |
| + Mexico | 16,992,418 | 1,416 | 21.2 |
| + Aguascalientes | 1,425,607 | 972 | 20.6 |
| + Tlaxcala | 1,342,977 | 1,241 | 20 |
| + Baja California | 3,769,020 | 269 | 17.2 |
| + Guanajuato | 6,166,934 | 3,369 | 15.6 |
| + Chihuahua | 3,741,869 | 1,050 | 9.4 |
| + Chiapas | 5,543,828 | 387 | 9 |
Source: Own elaboration based on SSA Daily Communiqués. https://www.gob.mx/salud/documentos/coronavirus-covid-19-comunicado-tecnico-diario
Source: Own elaboration based on SSA Daily Technical Communiqués. https://www.gob.mx/salud/documentos/coronavirus-covid-19-comunicado-tecnico-diario
Source: Own elaboration based on SSA Daily Technical Communiqués. https://www.gob.mx/salud/documentos/coronavirus-covid-19-comunicado-tecnico-diario
| Municipality | Population | Cases | Incidence Rate as of October 23 |
|---|---|---|---|
| Xochicoatlán | 7,015 | 4 | 57 |
| Jacala | 12,290 | 6 | 48.8 |
| Tepehuacán | 31,235 | 13 | 41.6 |
| Chapantongo | 12,967 | 5 | 38.6 |
| Juarez | 2,895 | 1 | 34.5 |
| San Bartolo Tutotepec | 17,699 | 6 | 33.9 |
| Nopala | 16,948 | 5 | 29.5 |
| Tepeapulco | 56,245 | 15 | 26.7 |
| Almoloya | 12,546 | 3 | 23.9 |
| Tenango de Doria | 17,503 | 4 | 22.9 |
| Huehuetla | 22,846 | 5 | 21.9 |
| St. Augustine Metz. | 9,449 | 2 | 21.2 |
| Lolotla | 9,474 | 2 | 21.1 |
| Pacula | 4,748 | 1 | 21.1 |
| Atotonilco de Tula | 62,470 | 12 | 19.2 |
| Molango | 11,578 | 2 | 17.3 |
| Tulancingo | 168,369 | 29 | 17.2 |
| Tasquillo | 17,441 | 3 | 17.2 |
| Ixmiquilpan | 98,654 | 16 | 16.2 |
| Nicolas Flores | 6,265 | 1 | 16 |
| Ajacuba | 18,872 | 3 | 15.9 |
| Atitalaquia | 31,525 | 5 | 15.9 |
| Alfajayucan | 19,162 | 3 | 15.7 |
| Villa de Tezontepec | 13,032 | 2 | 15.3 |
| Mineral de la Reforma | 202,749 | 31 | 15.3 |
| Apan | 46,681 | 7 | 15 |
| Tula de Allende | 115,107 | 16 | 13.9 |
| Pachuca de Soto | 314,331 | 43 | 13.7 |
| Zacualtipán | 38,155 | 5 | 13.1 |
| Tizayuca | 168,302 | 21 | 12.5 |
| Actopan | 61,002 | 7 | 11.5 |
| Tepeji del Rio | 90,546 | 10 | 11 |
| Pisaflores | 18,723 | 2 | 10.7 |
| Chilcuautla | 18,909 | 2 | 10.6 |
| Tlahuelilpan | 19,067 | 2 | 10.5 |
| Atlapexco | 19,812 | 2 | 10.1 |
| White Water | 10,313 | 1 | 9.7 |
| Metztitlan | 20,962 | 2 | 9.5 |
| Tlanalapa | 11,113 | 1 | 9 |
| Chapulhuacán | 22,903 | 2 | 8.7 |
| Zempoala | 57,906 | 5 | 8.6 |
| Mixquiahuala | 47,222 | 4 | 8.5 |
| Progress | 23,641 | 2 | 8.5 |
| Cuautepec de Hinojosa | 60,421 | 5 | 8.3 |
| Zimapán | 39,927 | 3 | 7.5 |
| Tlaxcoapan | 28,626 | 2 | 7 |
| Mineral del Monte | 14,324 | 1 | 7 |
| Huasca de Ocampo | 17,607 | 1 | 5.7 |
| Tlanchinol | 37,722 | 2 | 5.3 |
| Tecozautla | 38,010 | 2 | 5.3 |
| Cardonal | 19,431 | 1 | 5.1 |
| San Agustin Tlaxiaca | 38,891 | 2 | 5.1 |
| Santiago | 39,561 | 2 | 5.1 |
| Huautla | 20,673 | 1 | 4.8 |
| Acatlan | 22,268 | 1 | 4.5 |
| Acaxochitlán | 46,065 | 2 | 4.3 |
| Huichapan | 47,425 | 2 | 4.2 |
| Tezontepec de A. | 55,134 | 2 | 3.6 |
| San Salvador | 36,796 | 1 | 2.7 |
| Atotonilco el Grande | 30,135 | 0 | 0 |
| Calnali | 16,150 | 0 | 0 |
| El Arenal | 19,836 | 0 | 0 |
| Emiliano Zapata | 15,175 | 0 | 0 |
| Epazoyucan | 16,285 | 0 | 0 |
| Francisco I. Madero | 36,248 | 0 | 0 |
| Huazalingo | 12,766 | 0 | 0 |
| Huejutla de Reyes | 126,781 | 0 | 0 |
| Jaltocán | 10,523 | 0 | 0 |
| The Mission | 9,819 | 0 | 0 |
| Metepec | 13,078 | 0 | 0 |
| Mineral del Chico | 8,878 | 0 | 0 |
| Omitlán de Juárez | 9,295 | 0 | 0 |
| Santiago de Anaya | 18,329 | 0 | 0 |
| Singuilucan | 15,142 | 0 | 0 |
| Tepetitlan | 10,830 | 0 | 0 |
| Tetepango | 11,768 | 0 | 0 |
| Tianguistengo | 14,340 | 0 | 0 |
| Tlahuiltepa | 9,086 | 0 | 0 |
| Tolcayuca | 21,362 | 0 | 0 |
| Xochiatipan | 18,260 | 0 | 0 |
| Yahualica | 24,674 | 0 | 0 |
| Zapotlán de Juárez | 21,443 | 0 | 0 |
| San Felipe Orizatlan | 38,492 | 0 | 0 |
| Eloxochitlán | 2,593 | 0 | 0 |
Source: Own elaboration based on the information "Monitoreo de la Situación del Covid-19 en los municipios de México". https://covid19.ciga.unam.mx/apps/covid-19-monitoreo-de-la-situaci%C3%B3n-por-municipios/explore
WHO IS...?
José Aurelio Granados Alcantar holds a PhD in Regional Development and Territorial Planning from the University of Barcelona, Spain. He is a research professor in the academic area of Sociology and Demography, Institute of Social Sciences and Humanities (ICSHu) at the Autonomous University of the State of Hidalgo (UAEH). He is a member of the National System of Researchers, level I.