The descent of the fourth wave begins in Hidalgo

José Aurelio Granados Alcantar
Ph.D. in Regional Development and Territorial Planning
After three weeks with high levels of infection, during the most recent week, coronavirus infections decreased with respect to the previous week, from 4,115 cases registered during the week of January 30 to February 5, to 2,805 cases from February 6 to 12 (See Graph 1); in other words, a decrease of one third of the cases. This trend is already consolidated, which leads us to predict that by mid-March, infection levels will be as low as before the beginning of the fourth wave.
Similarly, there has been a slight decrease in deaths in the two weeks in question; 69 deaths were recorded in the last week, four fewer than last week, when 73 were recorded (see Graph 2). Hopefully, the number of deaths due to COVID-19 complications will begin to decline more sharply starting in March.
However, hospitalizations due to coronavirus complications are still high, since Hidalgo is the third entity with the highest occupancy of beds for general hospitalization, this indicator was 53.14% on February 12, only surpassed by Tlaxcala (100% occupancy) and Puebla (with 55.3% occupancy). 27.4% of ventilator beds were occupied and 46.1% of intensive care ventilator beds were occupied. (See IRAG Network Information System: https://www.gits.igg.unam.mx/red-irag-dashboard/reviewHome).
As we can see in Graph 3, from the first wave onwards, infections have been increasingly more intense than the previous one; that is, in the first wave the maximum average reached 131 coronavirus infections, in the second wave the maximum average was 292, in the third wave it was 401 and in the fourth wave it was 607. On the other hand, the maximum average number of deaths in the last two waves has fortunately been lower with respect to the second, which is the period of transmission where the number of deaths was the highest and the highest average reached 49 deaths; on the other hand, in the third wave of transmission it was 24 and in this last one it was 12 deaths (See Graph 4).
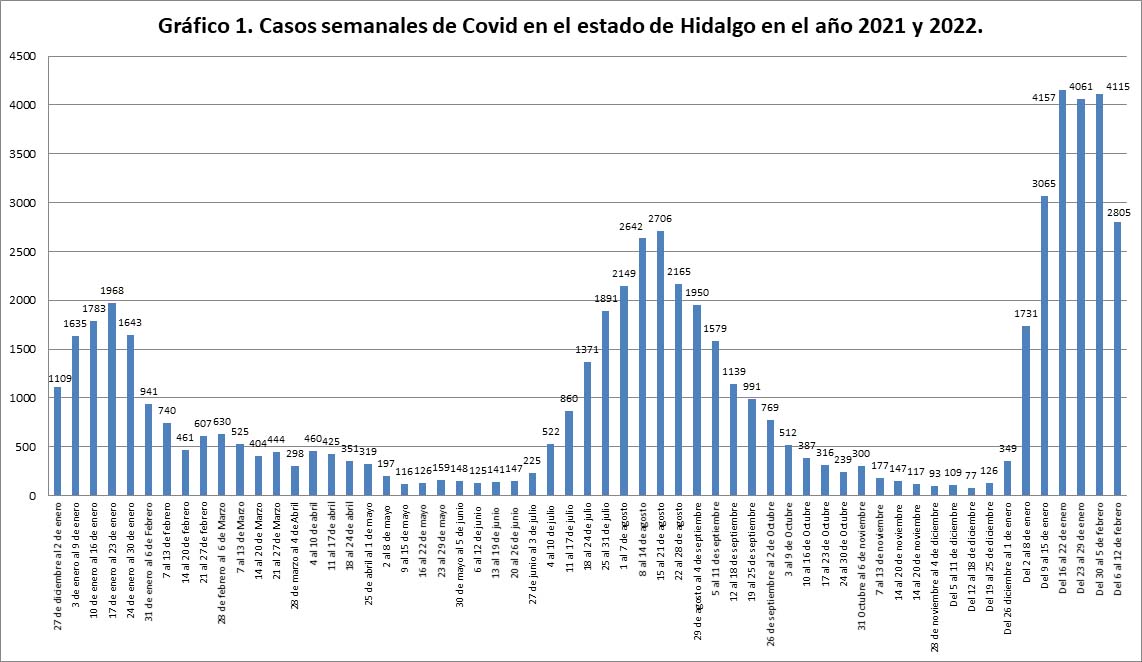
Source: Own elaboration based on the daily press releases of the Ministry of Health.
https://www.gob.mx/salud/acciones-y-programas/coronavirus-covid19-comunicados-tecnicos-diarios-historicos-2021
https://www.gob.mx/salud/acciones-y-programas/coronavirus-covid-19-comunicados-tecnicos-diarios-historicos-2020
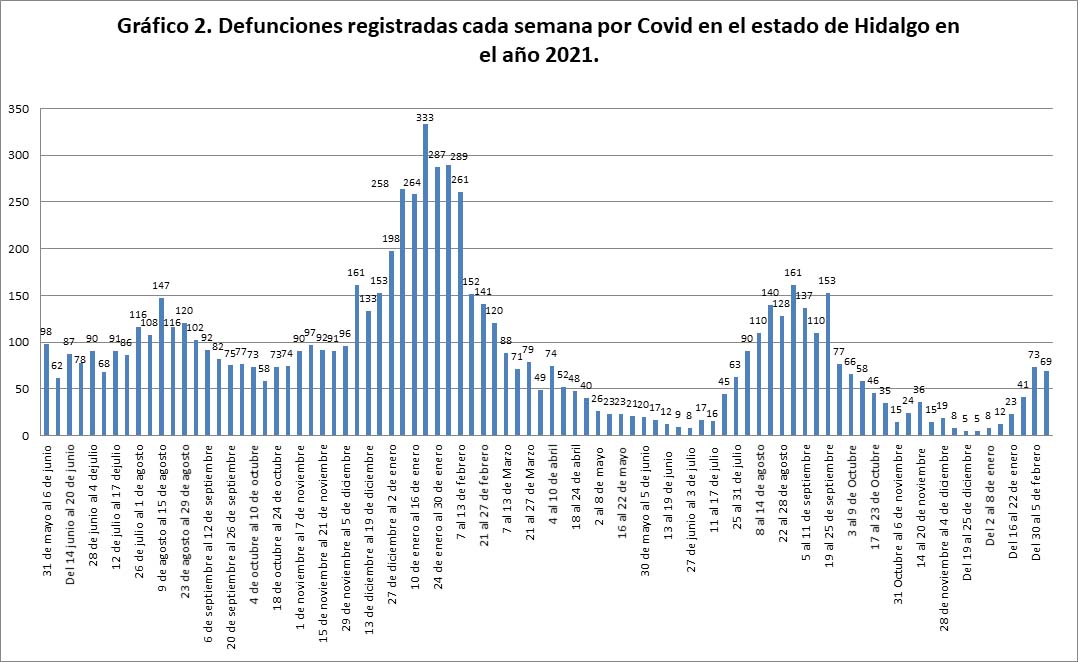
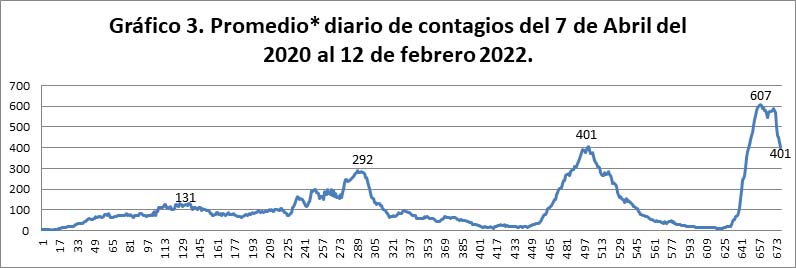
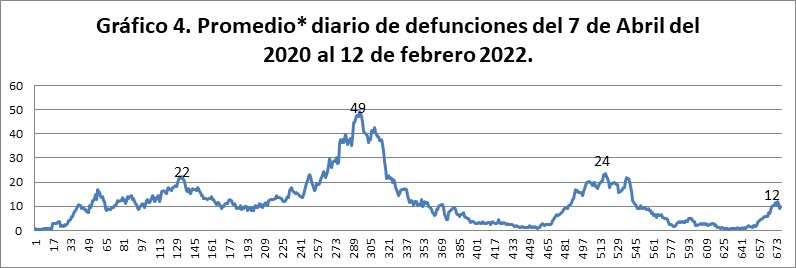
Source: Prepared by the authors based on the Daily Communiqués of the Ministry of Health.* Moving Averages, the moving average is used to smooth the data and reduce random fluctuations in a time series. Average of seven consecutive observations.
https://www.gob.mx/salud/acciones-y-programas/coronavirus-covid19-comunicados-tecnicos-diarios-historicos-2021
https://www.gob.mx/salud/acciones-y-programas/coronavirus-covid-19-comunicados-tecnicos-diarios-historicos-2020
WHO IS...?
José Aurelio Granados Alcantar holds a PhD in Regional Development and Territorial Planning from the University of Barcelona, Spain. He is a research professor in the academic area of Sociology and Demography, Institute of Social Sciences and Humanities (ICSHu) at the Autonomous University of the State of Hidalgo (UAEH). He is a member of the National System of Researchers, level I.